|
F 11/1/13
|
Last day of Q1.
HW due:
1. Prove that the PPV for the situation described in class is 0.141. We had
sensitivity = P(+ reading |
infected) = 0.98, specificity = P(–
reading | not infected) = 0.97, and a base rate of 0.5% of the population
infected.
2. Show that if the incidence of infection is greater than 0.5%, the PPV
increases, and if the incidence of infection is less than 0.5%, the PPV
decreases. You can do this with actual numbers if you are not an especially
good abstract thinker, but the preferred approach would be to use algebra
(letting x denote the incidence)
and to analyze the results you get.
|
|
|
M 11/4/13
|
HW due: Finish the
assignment that was due Friday. Because of Homecoming weekend, there is no
additional assignment, but you are expected to spend an additional 35 minutes
if necessary.
|
|
|
T 11/5/13
|
No additional written HW
due. Please make sure that you are fully caught up on old assignments.
|
|
|
W 11/6/13
|
HW due:
1. Consider the iterated map  that we were looking
at yesterday in class. After you have stored values for A and X as described
below, you will use the command followed by many,
many presses of your ENTER key in order to “iterate” this operation. that we were looking
at yesterday in class. After you have stored values for A and X as described
below, you will use the command followed by many,
many presses of your ENTER key in order to “iterate” this operation.
(a) Store 0.5 into A, and store any value you like between –1 and 1 into X.
Use your calculator (or a spreadsheet, if you prefer) to show that the
iterated map has predictable
(high-school algebra) behavior. Use the quadratic formula to prove that the
value that your calculator eventually “settles into” is correct. What is this
value (exactly)? Use radicals, not a decimal approximation, for your answer.
(b) Store 0.6 into A, and again store any value you like between –1 and 1
into X. Again, perform the iterated map until the calculator
settles on a value. What is it this time? A decimal approximation is acceptable.
(c) Store 0.7 into A. Use the quadratic formula to predict the behavior of
the iterated map  and write down your
prediction of the eventual value of X. Then perform the calculator iteration,
pressing ENTER ENTER ENTER
ENTER ENTER [etc.]. Were
you correct? and write down your
prediction of the eventual value of X. Then perform the calculator iteration,
pressing ENTER ENTER ENTER
ENTER ENTER [etc.]. Were
you correct?
(d) Store 0.8 into A. Perform the iterated map and describe the
behavior. Are you surprised?
(e) Store 0.9 into A. Perform the iterated map and describe the
behavior. Presumably you are no longer surprised, right?
(f) Store 1 into A, then run the experiment. Then, try 1.1. Then, try 1.2.
Or, if you’re short on time, don’t bother. What do you predict will happen in
each of these situations?
(g) Store 1.3 into A and rerun the experiment. Watch closely! Describe what
is different this time.
(h) Store 1.4 into A and rerun the experiment. Watch closely! Describe what
is different this time.
2. What did you learn by doing exercise #1? Write a sentence or two. If you
manage to use the word statistic or
statistics somewhere in your
answer, that would be great, but it is not required. (If you learned nothing
about statistics, don’t fake it. Just be truthful.)
3. A pair of fair standard dice are rolled. Fair standard dice have 6 faces,
numbered 1 through 6, and each face is equally probable. “Snake eyes” means
that both dice have a value of 1.
(a) Compute or estimate P(snake
eyes | at least one die shows a value of 1). Justify your reasoning with a
coherent explanation in English.
(b) You roll the dice but do not look at them. You feel around on the floor
and look at the first one you happen to touch. Compute or estimate P(snake eyes | the first die you touch
shows a value of 1). Justify your reasoning with a coherent explanation in
English.
|
|
|
Th 11/7/13
|
HW due: Read pp. 313-320,
323-329 (skip 330-332); write #6.49, 6.50, 6.52, 6.57, 6.66, 6.68, 6.73.
Note: Each problem requires some
work and/or a written explanation. “Bare answers” without work will not qualify
for full credit, even for obvious questions like #6.50ab. (Make a diagram in
that case. You can almost always make a diagram.) It is not OK simply to
write down the answer. Anybody can write down an answer, and as we saw
yesterday, almost anybody can even write a correct interval that includes the
true value, but that is not the same as understanding
the concept and communicating the
rationale for it to a reader.
|
|
|
F 11/8/13
|
No school (faculty work
day).
|
|
|
M 11/11/13
|
HW due: Read pp. 335-343;
write #6.81 on p. 346. Important: Write up your methodology, and
show all intermediate results in a table. It’s not enough to do the simulation; you also have to
document your initial assignments (i.e., what digits will correspond with
what outcome), and you have to document what digits you selected and what
choices those led you to. If you organize your table intelligently, with
appropriate column headings, you can minimize the amount of writing.
Extra credit opportunity: Instead
of doing 20 trials, as specified by the problem, do 20,000 trials. You will
need a spreadsheet or a computer program if you do that. The payoff is
twofold: bonus points (up to 5, based on quality of presentation) and a
better-quality estimate for the probability that Maria, Alex, Juan, and Jacob
complete their project on time.
|
|
|
T 11/12/13
|
HW due: Write your
methodology for the problem stated below, and execute at least 20 trials in
order to estimate the probability requested.
There are 32 students in the “floatstakes” for the
next lunch seating. Two have 8 chances each, one has 7 chances, 16 have 6
chances each, 11 have 5 chances each, and two students have 4 chances each.
Therefore, there are a total of 182 chances available in the drawing. The
student with 7 chances is a junior. You probably know him, since his favorite
word is “swag,” he has a preference for loud clothing, and he is captain of
the CyberPatriot team. Design and execute a simulation process to estimate
the probability that “Student J” is one of the 9 students chosen to float.
[There are 9, not 10, students who will be floating next time around.]
Note: The process we used in class
is not necessarily the most efficient, especially if you have a computer
available to help you sort and choose winners. Feel free to come up with a
completely different methodology, but you should describe it in sufficient
detail that it could be replicated by someone else. As before, bonus points
will be available if you use a spreadsheet to conduct a massive number of
trials.
|
|
|
W 11/13/13
|
HW due: Read pp. 357-365,
and then write the problem given below.
Problem.
As we saw in class yesterday, the number of heads obtained when a fair coin
is flipped 250 times can vary considerably. In our samples, we saw a low of
108 heads and a high of 140 heads, with the center value quite close to the
expected count of 125. A histogram of these results would approximate the
true probability distribution of the random
variable X defined by X = (# of
heads obtained in 250 flips of a fair coin).
Define a random variable Y = (# of
heads obtained in 11 flips of a fair coin). Note: This means that you have to write those words defining Y on your HW paper.
Then, perform 20 trials of 11 flips each (i.e., 220 flips in all, but divided
into 20 groups of 11), and graph your 20 outcomes as a histogram. In other
words, you will have so-and-so-many occurrences of 3, 4, 5, 6, 7, and 8 heads
when you perform 11 flips. You probably won’t have any trials that result in
fewer than 3 or more than 8 heads, but you never know! It’s possible! This is
similar to what we did in class yesterday, except with a more manageable
number of trials and a more manageable number of flips per trial.
|
|
|
Th
11/14/13
|
HW due: Read pp. 367-370; write
#7.10 and 7.18 on pp. 366-367, #7.26 on p. 372, and the problem given below.
Problem.
As you saw (or should have seen) in yesterday’s coin-flipping problem, the
distribution of Y is approximately
mound-shaped. You couldn’t see the true distribution of Y, since all you had
was 20 data points of what would theoretically be an infinitely large
probability distribution, but the true theoretical distribution of Y is called a binomial distribution. If you had repeated your experiment for
infinitely many trials of 11 flips each, you would have seen that the
binomial distribution has a mean of 5.5 and a standard deviation of 
(a) Compute the empirical mean and standard deviation for your Y values from yesterday’s data. Use
proper notation for each.
(b) Explain why your mean was not precisely 5.5, and why your standard deviation
was not precisely 1.658.
(c) Repeat yesterday’s simulation, but this time conduct 20 trials of 44
flips each. Let W be a random
variable that denotes the number of heads that occur when a fair coin is
flipped 44 times. Note: Using a
spreadsheet or a calculator program for coin-flipping is strongly
recommended.
(d) Make a histogram of the values you obtained for W.
(e) Compute the empirical mean and standard deviation for W. Use proper notation for each.
(f) Is the standard deviation for W
greater or smaller than the standard deviation you saw yesterday for Y? About how much greater or smaller
(as a factor)?
|
|
|
F 11/15/13
|
IMPORTANT: Do not enter MH-102 during the
CyberPatriot competition. Today’s class will be held in room MH-103 instead.
HW due: Read pp. 372-383; write #7.27ab, 7.29abc, 7.30 on pp. 383-384.
|
|
|
M 11/18/13
|
HW due: Read pp. 386-394;
write p. 395 #7.46, 7.50.
|
|
|
T 11/19/13
|
HW due: Read the material
below; write pp. 395-396 #7.51, 7.53, 7.56, 7.62.
Reading Material on Calculator
Techniques for Binomial and Geometric Distributions
The functions binompdf, binomcdf,
geometpdf, and geometcdf
are extremely useful for answering probability questions quickly. However,
you are not allowed to write these functions in your written work, since they
are considered to be “calculator notation.” You need to learn what the
expected amount of work is, as well as how to get the correct answer
efficiently. Each function is given below, together with an example or two of
what you would do (a) on a multiple-choice problem, where showing work is not
required, and (b) on a free-response problem, where all answers must be
adequately justified.
1. Mr. Hansen is a terrible free-throw shooter, hitting only 30% of his
shots. Compute the probability that in 12 tries, he hits exactly 5 shots.
(a) binompdf(12,.3,5) ENTER 0.158 [Note: You cannot write this work, or
if you do, “X” out the binompdf!]
(b) Let X = # of shots made in 12
trials. Assuming that p = 0.3 is
fixed, X follows a binomial
distribution with n=12, p=0.3. Therefore, P(X = 5) = 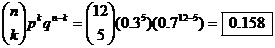 . .
2. In #1, assume that the count of free throws made follows a B(12, 0.3) distribution. Note: This is a useful shorthand
notation that means “binomial with n
= 12, p = 0.3.” Compute the
probability that Mr. Hansen makes 3 or more of his 12 shots.
(a) 1 – binomcdf(12,.3,2) ENTER 0.747
(b) Let X = # of shots made in 12
trials. By calc., we have
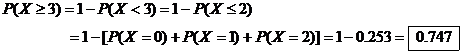
3. In #1, assume that trials are independent. Compute the expected number of
shots Mr. Hansen must take in order to sink a free throw.
(a) 1/.3 ENTER 3.333 shots
(b) and E(Y) = 1/p = 1/0.3 = 3.333
shots.
4. In #3, compute the probability that Mr. Hansen’s first success occurs on
the 4th shot.
(a) geometpdf(.3,4) ENTER 0.103
(b) Let Y = # of shots needed to
sink the first one. Since Y is
geometric with p = 0.3, P(Y
= 4) = P(missing 3, then hitting) =
qqqp = q3p = (0.7)3(0.3) = 0.103.
5. In #3, compute the probability that Mr. Hansen needs at least 4 tries to
succeed.
(a) 1 – geometcdf(.3,3) ENTER 0.343
(b) Let Y = # of shots needed to
sink the first one. Since Y is
geometric with p = 0.3,
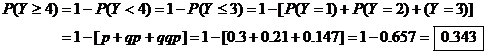
|
|
|
W 11/20/13
|
HW due:
1. Use this opportunity to get caught up on all previously assigned problems,
including the required amount of work, and all previously assigned reading.
2. Answer the following probability-type questions concerning license plates
in the nation of Slobbovia. License plates consist
of 2 capital letters (A-Z) followed by 4 digits (0-9). Show sufficient work.
(a) If all possible license plates are issued and one is selected at random,
compute the probability of selecting VZ 0258.
(b) Compute the probability of selecting VZ 0258, given that no symbols may
be repeated.
(c) If repeats are allowed, compute the expected number of zeroes in a
license plate and the s.d. of that number.
(d) Compute the probability of having more than 2 odd digits in a license
plate if repeated characters are allowed. Explain any simplifying assumptions
you make, and justify their reasonableness if appropriate.
(e) If all possible license plates are issued and cars are selected at
random, what is the expected number of cars that must be seen in order to
find one whose plate begins either with the letter V or with the letters ZZ?
(f) If all possible license plates are issued and cars are selected at
random, what is the probability of selecting 2 cars, neither of which has a
plate that starts with the letters GG, HH, II, JJ, or KK?
(g) If all possible license plates are issued and 15 cars are selected at
random, what is the probability of selecting at least one car whose license
plate begins with an M?
(h) Is the event A = {license plate
begins with an A} independent of the event B = {license plate begins with a consonant}? Explain.
(i) Compute P(license
plate begins with an A | license plate begins with a vowel}. Vowels in Slobbovia are defined as A, E, I, O, U, J, and Y.
In class: Review.
|
|
|
Th
11/21/13
|
Test (100 pts.) on all recent material, through §7.5. Essentially, we are talking about Chapters 6 and 7
here. Add the concepts of
sensitivity, specificity, disease incidence, and PPV (positive predictive
value), which were not in the textbook. Omit
Bayes’ Theorem, which was in the textbook but not
in pages that were assigned.
|
|
|
F 11/22/13
|
No additional written HW
due.
|
|
|
M 11/25/13
|
HW due:
1. Read pp. 397-412.
2. Express, in your own words (no “math talk”), the formula in the green box
at the bottom of p. 411. If possible, try to make it come alive with an
example that is personally meaningful to you.
3. Write p. 413 #7.71abcde, 7.73abcd. Show your “work” by means of rough
sketches.
|
|
|
T 11/26/13
|
HW due: pp. 413-414
#7.74-7.80 all. Monday’s assignment will also be scanned again.
Guest speaker, Mr. Joe Morris of MITRE
Corporation.
|
|