|
T 10/1/13
|
HW due: Begin gathering
data for your group project. A progress report (oral, in class) will be
required from each group leader. If the group leader is absent for any reason, he must deputize another
group member to give the progress report.
|
|
|
W 10/2/13
|
HW due: Read pp. 199-207
and work on your group project.
|
|
|
Th
10/3/13
|
HW due:
1. Group leaders, prepare an updated list of milestones and projected dates
(e.g., data gathering complete, analysis complete, first draft to Mr. Hansen,
final project report submitted, and any others you might wish to include).
These dates are not binding on you until we negotiate them later.
2. Read pp. 210-217. Reading notes are required, as always. Then, answer the
next question (#3) in writing on your HW paper.
3. Should the contents of the tan box in the middle of p. 213 be included in
your reading notes? Why or why not?
|
|
|
F 10/4/13
|
HW due: Read pp. 221-233,
and work on your group project.
|
|
|
M 10/7/13
|
HW due: Read pp. 238-252,
and work on your group project.
|
|
|
T 10/8/13
|
HW due: Continue working on
your group project, and write #5.56 on p. 253, with the changes indicated
below.
(a) As given in textbook.
(b) Try 2 specific transformations, namely (1) replacing x and y with log x and log y, respectively, before finding a LSRL, and (2) replacing y with log y before finding a LSRL. In other words, your first LSRL should
be of the form  and your second
should be of the form and your second
should be of the form  Sketch a residual
plot for each one. Note: You learned
how to do this in precalculus. All you have to do
to make a residual plot is to make an ordinary SCATTERPLOT, except with the
RESID list plotted on the vertical axis. Your calculator automatically builds
a RESID list every time you perform a STAT CALC 8 operation. Sketch a residual
plot for each one. Note: You learned
how to do this in precalculus. All you have to do
to make a residual plot is to make an ordinary SCATTERPLOT, except with the
RESID list plotted on the vertical axis. Your calculator automatically builds
a RESID list every time you perform a STAT CALC 8 operation.
(c) You’re going to have to do some algebra here! For each equation found in
part (b), do the “10 to the . . .” operation to each side of the equation.
Then, apply your knowledge of logs and exponents to come up with a simplified
model. Your predictor equation for model (1) should be of the form  and your predictor
equation for model (2) should be of the form and your predictor
equation for model (2) should be of the form  where K, L,
M, and N are values that you will figure out with your superior algebra
skills! Yes, you can do it! where K, L,
M, and N are values that you will figure out with your superior algebra
skills! Yes, you can do it!
(d) As given in textbook.
(e) Answer this question: What is it called if one performs a task such as
that described in the first sentence of (d) in the textbook? The answer is a single word beginning with the letter E.
|
|
|
W 10/9/13
|
HW due: Skip §5.5 (not an
AP topic), but read pp. 264-267 carefully. These pages contain a great deal
of crucial information. Item #8 on p. 267 is particularly important. Please
read the assigned pages at least twice. Reading notes are required, as
always. With your remaining time, finish up the entire homework assignment
from yesterday. The residual plots in the modified version of part (b) are
required!
|
|
|
Th
10/10/13
|
HW due:
1. Redo or improve your problem #5.56, which might be collected and graded a
second time. The standards, if the problem is collected, will be more
stringent than before. (In other words, even students who earned 4/4 should
take another stab at this. If your solution is nearly complete, you can make
your edits directly on your existing paper, but many students need to start
over from scratch.) You must have 2 residual plots, and they should be
labeled appropriately. Any conclusions you can draw along the way should be
stated clearly. Cryptic comments do not earn points. The common student
lament, “You should have been able to understand where I was going with
this,” does not earn any points, either. All axes should be labeled with numbers (minimum of 2 values), variable name, and units.
Note 1: Part (d) involves 3
questions, with an explanation required for the third. Make sure you answer
them all. Many of the papers that were checked on Wednesday were super-spotty
in this area.
Note 2: You don’t have to be
verbose. Remember the first example we looked at in class yesterday, where a
completely correct response, in a different context, was to say, “There is a
strong, negative, nonlinear relationship between age and impact rate.”
2. Write #5.68 and #5.72 on pp. 270-271. For #5.68, be sure to show your work
in part (c), and add a part (d) as listed below:
(d) Is the LSRL you obtained in part (a) a reasonable model? Give evidence to
support your conclusion.
Additional notes for #5.72:
You don’t need a statistical computer package; your calculator will work
adequately as long as you name your lists appropriately (LOGX, LOGY, RECIX,
and RECIY). When your book says “a scatterplot of y versus log(x),” the authors mean that the first variable listed is the
dependent variable (i.e., vertical axis) and the second variable listed is
the independent variable (i.e., horizontal axis). Thus “y versus log(x)” means
LOGX on the Xlist and Y on the Ylist.
|
|
|
F 10/11/13
|
No school (faculty
professional day).
|
|
|
M 10/14/13
|
No school (Columbus Day).
|
|
|
T 10/15/13
|
HW due: First draft of
group project writeup. Target length is 3 to 5
pages plus appendices. The group leader report should not be included until
the final submission.
The first draft should be as complete as possible and should, ideally,
include all components except for the group leader report. Here are the
components of the final report, in order from front to back:
1. Names of group members, with group leader name underlined.
2. Title and date. (A title page is not required. A title, centered near the
top of the first page, is sufficient.)
3. Research question.
4. Background information, if any.
5. Methodology.
6. Findings and analysis. Graphs and tables should be numbered (Fig. 1, Table
1, etc.) and cannot merely be “plopped” into your writeup.
Each graph and table should be mentioned by number in the body of the text.
It is good to include your graphs and tables amidst the general text of your writeup, rather than putting them on separate sheets of
paper. That way, there is less interruption to the flow of the text and less
flipping back and forth. If you include a landscape-oriented graph or table
as a separate sheet, it must be oriented so that it is readable when the
paper is rotated clockwise.
7. Conclusions.
8. Questions for further research, if any.
9. Appendices. All groups are required to include an appendix consisting of
raw data. List the records that you gathered, with the field names going
across the top and the subject names/IDs going down the left side. An example
is shown below. Other appendices (e.g., supporting information from other
sources) may be included if you wish. If you used a written survey instrument
to gather data, be sure to include it as a separate appendix, and refer to it
in the methodology section of your main text.
Each appendix must start on a new sheet of paper and must be labeled.
Example:
Appendix A: Raw data table.

10. Group leader report. Recommend and justify the point split that
you feel is appropriate, giving 3 values that add up to 300. For example, if
you feel that all group members contributed approximately equally to the
project, you can recommend a 100-100-100 split. Important: You must
describe the specific tasks that
each person performed. Vague generalities are not permitted. You want to say
something like this: “Billy and I did the randomization and recruitment of
volunteers, while Joe entered all the survey data into a spreadsheet. Joe did
all the analysis, except for Fig. 1 and Table 3, which were done by Billy. I
supervised them and wrote the first draft while talking on Skype with the
other two. Billy and his younger brother did all the proofreading. Joe
tweaked some of the fonts and produced the final writeup.”
Note to group leaders: Even though
you will not submit the group leader report until Thursday, you should be
thinking before then about what to write.
|
|
|
W 10/16/13
|
HW due: Review problems as
listed below.
pp. 185-186 #4.49, 4.50
p. 193 #4.55, 4.56, 4.57
p. 195 #4.69
pp. 271-272 #5.73, 5.74
pp. 253-254 #5.57
In class: Review.
|
|
|
Th
10/17/13
|
Test (100 pts.) emphasizing recent material through
Chapter 5. Earlier material,
however, cannot be forgotten. For example, you need to keep the distinction
between  and and  (sample mean and
population mean, respectively) crystal-clear in your mind all year long, and
most of the terms we learned in preparation for the first test (skewness, distribution, modified boxplot,
histogram, etc.) are just as important now as they were before. (sample mean and
population mean, respectively) crystal-clear in your mind all year long, and
most of the terms we learned in preparation for the first test (skewness, distribution, modified boxplot,
histogram, etc.) are just as important now as they were before.
It is fair to say that this test assumes that you are familiar with all
material discussed in class and all material presented in the textbook during
the entire semester to date.
|
|
|
F 10/18/13
|
HW due: This is the target
date for submission of your final project writeup.
However, since Mr. Hansen will be at a teacher conference in Baltimore, you
may delay submitting the final project until Monday if you wish. There will
be a bonus of 2 points per student for projects submitted by midnight
tonight. (Slip your projects underneath the door of Mr. Hansen’s office,
MH-104.)
In class: Educational video.
|
|
|
M 10/21/13
|
HW due: Group project writeup (final).
A quiz on the Simpson’s Paradox video
is likely today. You’ll need to watch the video online if you slept through
part of it or were absent on Friday.
|
|
|
T 10/22/13
|
In recognition of the
difficult weekend that many of you had, and in honor of the fact that all 6 projects
were submitted on time, there is no additional HW due today. Please enjoy the
beautiful fall weather that you were unable to enjoy fully over the weekend!
Quiz originally scheduled for
yesterday (on Simpson’s Paradox) will probably occur today.
|
|
|
W 10/23/13
|
HW due: Read pp. 279-286;
write #6.6 and #6.10 on p. 287.
|
|
|
Th
10/24/13
|
HW due: Read pp. 288-299;
write solutions to the Monty Hall problem
and the Chest of Drawers Problems (both
A and B).
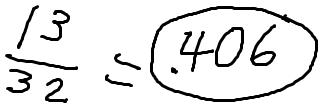
Note: The word “solution” is
different from the word “answer.” Answers written without explanation of the
reasoning process involved will receive no credit. For example, if you
believe that the answer to one of the problems is 13/32, you will receive no
credit if all you write is this:
|
|
|
F 10/25/13
|
HW due: Read pp. 302-310;
write pp. 310-311 #6.30-6.34 all (to completion), and start working on the Mini-Project
on Conditional Probability (questions 3-6 only), which will be due
Monday.
|
|
|
M 10/28/13
|
HW due: Mini-Project on Conditional
Probability (questions 3-6 only). By “resident” we will assume that
students who attend school in Washington, DC, count as residents even if they
sleep in Maryland or Virginia. We won’t count commuters who work in DC as
residents, however. You can use the following estimates for P(S),
P(U), and P(G) if
you provide a few words of explanation for each:
P(S) = 0.68
P(U) = 0.0005
P(G) = 0.001
Question #6 is referring to the screening of asymptomatic patients. For
example, it was common until recently that physicians would subject healthy
men over the age of 50 to a PSA test in order to screen for prostate cancer.
However, the U.S. Preventive Services Task Force recommended about 2 years
ago that this practice be discontinued. The PSA test is not particularly
accurate, but accuracy is not the issue. Even if the PSA test were much more
accurate, there would still be a problem with screening healthy patients for
prostate cancer. Using the 4 ng/ml criterion for
determining when a patient may have prostate cancer, the PSA test has
sensitivity of 0.205 and specificity of 0.936 [source :
http://www.ncbi.nlm.nih.gov/pubmed/17269614]. In other words, if C is the event that a patient truly
has prostate cancer, and if S is
the event that his screening test produces a positive reading, then P(S
| C) = 0.205 and P(~S
| ~C) = 0.936. The probability of a
false positive, according to the source cited, is about 0.062. (Apparently
there are 0.02% of patients without cancer whose results are inconclusive.)
Also, read the paragraphs below.
You need to know that for events,
independence is defined in terms of conditional probability. For example, we
say that event A = finding a nickel
on the street within the next 60 minutes is independent of event B = Calvin defeats Mr. Hansen in
chess, since P(A | B) = P(A).
In other words, if the unconditional probability of an event is the same as
the conditional probability given some other event, then the events are
independent.
Note: Independence is not the same
as mutual exclusivity. For example, couldn’t it happen that you find a nickel
on the street within the next 60 minutes, and
Calvin defeats Mr. Hansen in chess? Of course it could. Simply because two
events could both occur doesn’t keep them from being independent.
Independence means that the occurrence (or non-occurrence) of one event does
not affect the probability of the other. That’s all it means!
Event Q = drawing a queen as the
second card drawn from a well-shuffled deck is not independent of event J
= drawing a jack as the first card, since P(Q | J) = 4/51, whereas the unconditional probability P(Q)
is 4/52, and those answers are not equal.
Why, you ask, does P(Q) equal 4/52? The reason is that to
find the unconditional probability
of a queen on the second draw, you have to ask yourself, “How many unknown
cards are still out there?” The first card, since its value was not given, is
unknown. Therefore, there are 52 unknown cards, 4 of which are queens.
|
|
|
T 10/29/13
|
HW due: Prepare the review
problems below for oral presentation. Written notes are encouraged but will
not be collected.
p. 310 #6.29
p. 312 #6.38abc
Add part (c) as follows: Repeat part (a) without converting
counts to proportions. Which method is easier?
pp. 312-313 #6.39
p. 313 #6.40
p. 350 #6.88, 6.92
p. 351 #6.95, 6.96
These will not be graded, but you should (at a minimum) familiarize yourself
with the questions being asked. For example, when we cover #6.96(b) in class,
you should be familiar enough with the problem that you can say, after only a
moment’s thought, “There are 19 good bulbs remaining out of 24, so the answer
is 19/24.”
|
|
|
W 10/30/13
|
Quizzes (2 of them, 10 pts. each) covering
essentially everything through §6.4, ending on p. 310. One quiz will be easy, designed to boost averages,
and the other will be more challenging. One quiz will be on probability, and
one will be on regression (linear and/or nonlinear). Other smaller topics,
such as standard notation and terminology, may be added to either or both
quizzes.
|
|
|
Th
10/31/13
|
No additional written HW
due.
|
|