|
T 11/1/011
|
Quiz (10
pts.) on last Tuesday’s Quick
Study article; handwritten notes permitted.
HW due:
1. Read pp. 313-320.
2. Write #6.34, #6.36.
|
|
|
W 11/2/011
|
HW due:
1. Read pp. 323-328.
2. Read this week’s new Quick
Study, and prepare for another open-notes quiz.
3. Write #6.52 on pp. 321-322, #6.66 on pp. 333-334.
Bonus problem (1 point): I will
roll a pair of fair dice. Sam, my trusted student, will tell me if at least
one “6” is showing. Given that there is at least one “6” showing, what is the
probability that the dice are showing “boxcars” (double 6)? Explain your
reasoning.
Double bonus problem (2 points): I
use the special compound hexahedral randomizer demonstrated in class (red,
white, and blue tiny dice inside a plastic cube) to roll 3 dice at once. Sam,
my trusted student, will tell me if at least one “1” is showing.
(a) Given that there is a “1” on at least one of the tiny dice, what is the
probability that all 3 tiny dice have a “1”?
(b) Now answer this slightly different question: Given that the red tiny die
shows “1,” what is the probability that all 3 tiny dice have a “1”?
|
|
|
Th 11/3/011
|
HW due: Read pp. 335-343; write #6.70ab, 6.74. The
new Quick Study quiz is also a possibility today (see link in 11/2 calendar
entry).
|
|
|
F 11/4/011
|
No school (faculty meetings).
|
|
|
M 11/7/011
|
No additional HW due. Please attend Flowers for Algernon over the weekend,
and get caught up on all your previously assigned problems. I expect all of
these to be clean and correct. E-mail me over the weekend if you need help.
In class: Possible Quick Study quiz, quadruple or quintuple
HW scan.
|
|
|
T 11/8/011
|
HW due:
1. Preferably without consulting any online sources, compute the probability
of receiving “4 of a kind” on the deal in 5-card draw poker, with no wild
cards. Hint: The denominator is 52C5 = 2,598,960. Can you
explain why? In the numerator, you need to count all possible hands (order
irrelevant) in which 4 of a kind and 1 junk card occur.
2. When 2 cards are drawn (without replacement) from a well-shuffled deck,
compute the probability of at least one face card. A face card is defined as
a jack, a queen, or a king only.
3. Design a simulation to answer either #1 or #2 (your choice). Write out all
steps in detail, following the guidelines in your textbook. For your
randomness, you will use a table of random digits, not an actual deck of
cards. Be sure to describe the correspondence between numbers and simulated
cards, and be sure to explain how to compute your probability estimate at the
end of the simulation.
|
|
|
W 11/9/011
|
HW due:
1. Yesterday you wrote up a simulation of either the “4 of a kind” question
or the “probability of at least one face card” question. Today, write up the
other one. If you did not do one yesterday, both are required for today.
Follow the instructions given in the textbook and in class.
2. Write #6.79 on pp. 345-346. Use the random digit table on pp. 814-815 in
order to perform your simulation, and record your results in a table similar
to the table at the bottom of p. 345. Your work will be graded for accuracy. Note:
If you do 20 iterations, that is fine, but it will take you forever. It is
acceptable to do 8 iterations. Each student must begin on a different row of
the random digit table, as follows:
Please see the example tabulation here. The example
begins with row #1 of the random digit table, which means that you cannot
simply copy the results. However, feel free to mimic the format, especially
in the computation of the sample proportion values.
|
|
|
Th 11/10/011
|
HW due:
1. Read #5.78 (p. 272), and write the first part only (the scatterplot). We
will do the rest in class.
2. Write #6.93c (pp. 350-351) and #6.94 through 6.97 all (p. 351).
3. Redo #6.79, the treatment simulation from yesterday. You may stop after 4
iterations if you wish. Note: An “iteration”
consists of however many pairs must be treated until one treatment’s score
exceeds the other’s by at least 2. Your work will be graded for accuracy.
Please see the example tabulation to make sure that
you are using the correct random digits. Each student begins on a different
row number (see 11/9 calendar entry) and should continue on subsequent rows,
not skipping any digits.
|
|
|
F 11/11/011
|
HW due:
1. Prepare for a quiz on this
week’s Quick Study article. We will have only about 4 more weeks of
these.
2. Write #5.72 on p. 271. Use your calculator to construct the requested
scatterplots, and sketch them (including units) on
your HW paper. Store your x values
in L1 and your y values
in L2. Use the technique shown in class. For example, to perform a
plot of 1/y versus 1/x, you would perform the following
steps:
1/L1 STO L3
1/L2 STO L4
STAT CALC 8 L3,L4,Y1
3. In #5.72, note that in order to answer part (b), you will have to do a
little bit of algebra, as demonstrated in class, in order to find the
equation for  that you can use to
predict lead content when distance is 25 m. Produce a residual plot for this model (i.e., a plot of y – on vertical axis, x on horizontal axis), not a residual plot for the
transformed variables that you felt best achieved linearity. that you can use to
predict lead content when distance is 25 m. Produce a residual plot for this model (i.e., a plot of y – on vertical axis, x on horizontal axis), not a residual plot for the
transformed variables that you felt best achieved linearity.
4. Write a simulation methodology to address the Animal Cracker Questions below.
5. Execute 15 iterations and report your estimates for  and m with respect to the Animal Cracker
Questions. Use a neat table to organize your intermediate results clearly. Note: 15 iterations means 15 “success”
or “fail” decisions, which will take many more than 15 simulated cracker
draws. and m with respect to the Animal Cracker
Questions. Use a neat table to organize your intermediate results clearly. Note: 15 iterations means 15 “success”
or “fail” decisions, which will take many more than 15 simulated cracker
draws.
Animal Cracker Questions
A nearly empty box of animal crackers contains only 5 crackers: 1 each of
lion, tiger, bear, elephant, and platypus. Crackers are drawn at random,
without replacement, and we are interested in knowing
(a) the probability that both big cats appear before the platypus is drawn,
and
(b) the expected number of crackers, m,
that must be drawn in order to see either the platypus or both big cats.
|
|
|
M 11/14/011
|
HW due:
1. Read this handout on probability.
Pay special attention to the example problems, and try to learn something
from each one of them.
2. On a separate sheet of paper, write out the solutions to problems 1-8
found at the end of that same
handout.
3. Back in the year 2000, in the thick of the controversy about the Bush-Gore
presidential election, the STAtistics class read an article in which the
author claimed that an error rate of 0.05% would produce a 3000-vote error in
6 million votes. Do you think that is true? Explain your reasoning.
4. Design a simulation to address the question posed in #3. Hint: A voting process that has an
error rate of 0.05% (which is much
more accurate than any system currently used anywhere in the U.S.) would
record the correct result 99.95% of the time. For simplicity, assume that
there are only 2 candidates, and let us refer to them as “Bush” and “Gore.”
Assume that each candidate receives exactly 3 million true votes out of 6
million cast, and assume that each error that occurs
is recorded as a vote for the other side.
5. Answer questions 3-6 on this
handout. If you cannot finish all of them, do as many as you can. Keep a
time log. For #3, let P(S) = 0.6, P(U) = 0.00062, and P(G) = 0.001. In class, we will go
through as many as time permits. You
are responsible for being able to do all problems of this type on tomorrow’s
test, as well as “transformations to achieve linearity” similar to the
homework problems we did last week.
|
|
|
T 11/15/011
|
Test (100
pts.) on all recent material, through the end of Chapter 6.
Solutions to yesterday’s review problems 3 and 4, plus questions 3-6 from the
second handout, are posted
below to assist you with your test preparation. Remember, there will probably
also be some regression-type problems on the subject
of “transformations to achieve linearity.”
3. [Answers will vary.] Common sense tells us that not all of the errors will
go in the same direction. True, there may be thousands of errors, and in fact
6 million multiplied by 0.05% is exactly 3000, but many of those errors will
cancel each other out. The expected number of net errors (i.e., the
discrepancy in the vote counts, which is what the problem asks for) will
probably be smaller than 3000.
4. [One possible methodology is shown below. Answers will vary.]
(1) Start with simulated “Bush” votes. Draw
4 digits at a time from a random digit table.
(2) If the selection is 0000, 0001, 0002,
0003, or 0004, record a vote for Gore (i.e., an error). Otherwise, record a
vote for Bush.
(3) Repeat steps 1 and 2 a total of 3
million times.
(4) Now perform the simulated “Gore”
votes. Again, draw 4 digits at a time from a random digit table.
(5) If the selection is 0000, 0001, 0002,
0003, or 0004, record a vote for Bush (i.e., an error). Otherwise, record a
vote for Gore.
(6) Repeat steps 4 and 5 a total of 3
million times.
(7) The “true” count is 3 million for
Bush and 3 million for Gore. Record the absolute value of (simulated Gore
votes – 3,000,000) as the error outcome of the simulated election.
(8) Since everything that went before
constitutes a single iteration, we need to repeat steps 1-7 many more times,
say 40 times in all.
(9) There should now be 40 recorded
values for the number of voting errors in simulated elections. Add these up
and divide by 40 in order to obtain a value for  the sample mean from
the simulation process. Note that the sample mean from
the simulation process. Note that  is an estimate of is an estimate of  , the true mean absolute number of vote errors. , the true mean absolute number of vote errors.
You were not asked to perform the steps in your methodology for #4. That
would take a lifetime to perform by hand, of course! In case you are curious,
the following results have been obtained on a computer simulation of 40
trials with 6 million simulated votes each:  The distribution of
the sampled values is highly skew right. The 5-number summary of the absolute
number of voting errors in 6 million simulated votes was 2, 17, 67, 115, 358,
with n = 40. The distribution of
the sampled values is highly skew right. The 5-number summary of the absolute
number of voting errors in 6 million simulated votes was 2, 17, 67, 115, 358,
with n = 40.
Conclusion: The expected vote error in 6 million votes, assuming each
candidate was “voted for” by exactly 3 million people, is almost certainly
much lower than 3000. A conservative estimate would be 200 or fewer.
Next interesting question: What if the error rate is a higher, more realistic
value? Using 2.5% as the error rate, and 40 simulated trials with 6 million
votes each, the results were as follows:  5-number summary 6,
236, 468, 894, 3258. Once again, the distribution is
highly skew right, but the expected vote error is clearly still far below
3000. 5-number summary 6,
236, 468, 894, 3258. Once again, the distribution is
highly skew right, but the expected vote error is clearly still far below
3000.
Did you notice that increasing the error rate by a factor of 50, from 0.05%
to 2.5%, did not cause the expected
number of errors to increase by a comparable factor? That’s the kind of stuff
that some students find interesting. Your teacher certainly does . . .
Probability Questions from Second Handout
3.(a) P(S) = 0.6 (given)
(b) P(U) = 0.00062 (given)
(c) P(G) = 0.001 (given)
(d) P(U | S) = 0.00062
(e) P(S | U) = 0.6
(f) Yes, S and U are independent, since neither
affects the other one’s unconditional probability.
(g) P(G | U) = 0, since no Upper School student has ever been seen wearing galoshes.
(h) P(U | G) = 0 for the same reason.
(i) P(G | ~S) = 0.002 (estimated), since it is more likely that an owner of
galoshes would wear them on a non-sunny day than on a general day
(j)  0, since P(G
| U) is already known to be 0. 0, since P(G
| U) is already known to be 0.
(k) No, U and G are not independent, because the
unconditional probability P(G) is nonzero,
while P(G | U) = 0.
[Alternate answer for part (k): U
and G are disjoint and therefore
cannot be independent unless both are null, but it was given that both P(U) and P(G) are nonzero.]
(l) No, G and S are not independent. Common sense
tells us that P(G | S) < P(G), as a corollary of part (i). Since
the conditional probability does not equal the unconditional probability, G and S are not independent. [Alternate answer for part (l):  is essentially 0, since
hardly anyone would wear galoshes on a sunny day. A reasonable estimate is
0.0002. However, P(G) = 0.001 (given), P(S)
= 0.6 (given), and their product is is essentially 0, since
hardly anyone would wear galoshes on a sunny day. A reasonable estimate is
0.0002. However, P(G) = 0.001 (given), P(S)
= 0.6 (given), and their product is  which is much larger
than the joint probability . Since the joint probability does not equal the product of
probabilities, events G and S are not independent.] which is much larger
than the joint probability . Since the joint probability does not equal the product of
probabilities, events G and S are not independent.]
(m)  = 0.002 (estimated
from part (l)) = 0.002 (estimated
from part (l))
(n) 
4.(a) P(H | A) = (1 heart out
of 4 aces, equally likely) = 0.25
(b) P(K | ~A) = (4 kings out of 48 non-aces, equally likely) = 0.0833
(c) P(K | A) = 0, since no kings are aces
(d) Yes, K and A are mutually exclusive, since no
kings are aces.
(e) No, K and A are not independent, since P(K) = 1/13, but P(K | A) = 0, which is not the same value.
(f) P(~A | ~H) = (36 non-aces out of 39 non-hearts, equally likely) = 0.923
(g) P(~A) = (48 non-aces out of 52 cards) =
0.923
(h) No, A and H are not mutually exclusive, since
there is a card (the ace of hearts) that satisfies both events.
(i) Yes, A and H are independent, since P(ace of hearts)
= P(A) · P(H) =  [Joint probability equaling product of
probabilities is one way of testing for independence.] [Joint probability equaling product of
probabilities is one way of testing for independence.]
(j) P(R | A) = (2 red cards out of 4 aces, equally likely) = 0.5
(k) P(R | H) = (13 red cards out of the 13 hearts) = 1
(l) 
[Alternate method: Since color and suit are independent of value, simply
compute the unconditional probability P(K) = 1/13.
That is a much faster way to get the answer.]
(m) No, H and R are not mutually exclusive. In fact,
all hearts are examples of red
cards.
(n) No, H and R are not independent, since the
unconditional probability P(R) = 0.25, but the conditional
probability P(R | H) = 1, since all
hearts are red. Since 0.25 differs from 1, events R and H are not
independent.
5.(a) S =
event that a randomly selected cigarette is being smoked by a randomly chosen
person
P =
event that a randomly chosen person has a diagnosable psychological condition
(b) P(P) = 0.2
P(P | S) = 0.44
(c) Begin by representing the situation involving all American
adults and all the cigarettes they might smoke:
Believe it or not, it turns out not to matter how large the regions marked a and b are. The only important things to notice are that 44% of all
the smoking that occurs (circle S)
is accomplished by people in circle P,
the psychologically impaired, and that we were told that circle P is 20% of the universe. In other
words,  . .
We cross-multiply and simplify the algebra (Please do this! Don’t make your
teacher do all the work!) to get
a + b + 100 = 5a + 220
b = 4a + 120
Let N denote the population of the
universe, i.e., a + b + 100. The question we are trying to
answer is to find the ratio of P(S | P) to P(S). Here we go:
However, since we know that b = 4a + 120, we can substitute to get

6. For diseases that are rare and have no symptoms, most of the positive
readings will be false positives, even if the screening tests are extremely
accurate.
|
|
|
W 11/16/011
|
HW due:
1. Read this
article. Some of it will make sense today, and some will make more sense
in the months ahead.
2. Complete the take-home
portion of yesterday’s test. You may consult your notes. However,
collaboration with other students is not permitted for this sheet.
3. Also redo the following problems from yesterday’s test. Feel free to
consult your notes. (This is an open-note take-home assignment. If you work
with another student on these problems, that is acceptable, but you must document any collaboration that
occurs.)
9. A screening test for yawnitis is 99%
sensitive (i.e., P(pos.
| infected) = 0.99) and 97% selective (i.e., P(neg. | not infected) = 0.97). Compute the PPV of the test if
yawnitis affects 2% of all students.
10. PPV stands for ____________ ____________ ____________ and means
____________________________________________________________ .
|
|
|
Th 11/17/011
|
HW due:
1. Prepare for a possible quiz (or two quizzes) on last
week’s Quick Study and this
week’s Quick Study. Handwritten notes are permitted.
2. Read pp. 357-365. Reading notes are required, as always.
3. Calculate the probability of a flush on the deal in 5-card draw poker.
Note: Some
definitions may help. A straight
is 5 cards, all in some order, but not
all of the same suit. “Wraparound” hands are not
permitted. For example, 7-8-9-10-Jack, but not all of the
same suit, would be called a straight, but King-Ace-2-3-4 would not.
A straight flush
is similar to a straight, except that all 5 cards must be of the same suit.
There are 40 straight flushes possible, since the lowest-value card can be
any of A, 2, 3, 4, 5, 6, 7, 8, 9, or 10, and there are 4 suits to choose
from. The multiplication rule applies: 4(10) = 40. Of the 40 straight flushes
that are possible, the 4 “royal flushes” (10-J-K-Q-A all of
the same suit) are the most valuable. In fact, in a normal deck with
no wild cards, a royal flush is the highest hand that anyone can achieve. The
probability of a royal flush is extremely low: 40/2598960, which gives odds
of 649,730:1 against such an occurrence on the deal.
A flush is
defined to be 5 cards all of the same suit, except
that those cards cannot form a straight flush. In other words, when you
calculate the probability of a flush, you will need (at some point) to
exclude the 40 straight flushes that are possible.
4. Write a simulation methodology, using a random digit table, to address the
question posed in #3. Do not actually execute the steps; simply write them
down so that a reasonably intelligent clerk could perform the simulation.
|
|
|
F 11/18/011
|
Oops! Today’s assignment was supposed to be posted
by 3 p.m. Thursday, but because of a house furnace failure (thermostat,
actually), your Fearless Teacher was distracted and forgot to post it in
time. Thus there is no additional HW due today.
|
|
|
M 11/21/011
|
HW due:
1. Read pp. 367-370. Reading notes are required, as always.
2. Research the problem below, and write coherent sentences or short
paragraphs in your own words to
answer questions (a) through (c) at the bottom.
Problem: By using standard
formulas for combinations, the Multiplication Rule, and “common sense,” we
obtained the (possibly erroneous) formula
P(3 of a kind on the deal in 5-card
draw poker) = 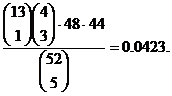
However, we also ran an Excel spreadsheet simulation in class on Friday. As
Nathan pointed out, the simulation was (if anything) an overestimate since we were including full houses, which we should
have excluded. Our simulation results ranged from a low of 74 to a high of
113 successes out of the valid trials that we obtained (normally about 4100).
In other words, our values from
simulations ranged from approximately 0.018 to 0.0276, with a mean somewhere
in the 0.22 or 0.23 ballpark. Now, it doesn’t take a
genius to see that either our simulation was seriously flawed, or the formula
above is WRONG, or both. The
questions are as follows:
(a) Is there a bug in the formula? If so, correct the formula and continue
with (b1). If not, continue with (b2).
(b1) If so, how did the bug creep into the formula? In other words, exactly what caused it to be so
believable?
(b2) If not, why was our simulation so far off? Explain where you think we
went wrong.
(c) Which do you trust more: a “common sense” formula, or a Monte Carlo
simulation? Explain your answer.
|
|
|
T 11/22/011
|
HW due: Write #7.14 (p. 366) and #7.20 (p. 371).
|
|
|
W 11/23/011
|
No school (Thanksgiving break).
|
|
|
M 11/28/011
|
School resumes.
In class: Written methodology and selection of groups for second project
(simulation).
Group 1: Joe, Bogdan, Matt
Group 2: Kieran, Steven,
Sam
Group 3: Karl, Frederik,
Nathan, Miles
|
|
|
T 11/29/011
|
HW due: Group leaders are responsible for organizing
a written project proposal for a simulation project. If the group leader is
absent for any reason, a deputy must deliver the proposal. Ground rules are
as follows:
1. The proposal must describe a question involving a mean (expected value) or
a probability.
2. The question should be non-obvious and at least somewhat interesting. If
you are devoid of ideas, see the sample project ideas below.
3. The question should not have an
answer that can be readily determined by formula. However, it is OK if a
“first-order” approximation of the answer can be determined by formula, since
that will give you a clue as to whether your simulation is working correctly.
4. Methodology is not required for today. That will come later. However, you
may be interested to know that all groups will eventually be required to use
as their source of random numbers an Excel table of 1 million random digits,
organized into 50,000 rows of 20 digits each. That may have some influence on
your choice of project.
5. All members of the group must “buy in” to the proposal. Try to find
something that everyone finds interesting.
6. Final report, including carefully written methodology and proof of
execution, will be approximately December 7, Pearl Harbor Day.
7. Group 3 has more members and therefore a slightly higher quality
expectation.
Sample project ideas:
1. When 2 fair dice are rolled many times, what is the expected number of
rolls needed to increase the value of the previous roll by at least 1, given
that the game will restart each time a roll of 12 is obtained? Note: The expected value is small if
the previous roll is small, and the expected value is large (36, in fact) if
the previous roll is 11. The question is, what is
the overall expected value, taking account of the fact that we will always
have a mix of “previous roll” values?
2. You and a friend are wagering even money (i.e., $1 against $1) on the
question of whether it is more likely or not that in a run of 20 random
digits, 2 or more distinct digits will occur in pairs or better. For example,
01829492844029349000 is a “success” since 2 or more distinct digits (namely 4
and 0) each occur in a pair or better, and 01829949284029349990 is a failure,
since even though 9 occurs as a pair and again as a triplet, there are not at
least 2 distinct digits that have
that property. Which side of this bet should you take: the side that says a
success is more likely than 50%, or the side that says success is less likely
than 50%?
3. When an airplane is loaded, which strategy is better: 3-zone boarding
using assigned seating, with the rearmost sections boarding first, or
boarding “at will” by passengers using priority cards of A, B, and C that are
assigned based on time of arrival at the boarding gate? You will have to make
some simplifying assumptions regarding parameters (e.g., full plane of 90
passengers, 3 sections of 30 seats each, 6 seats per row, 3 on each side of
the aisle). You will also have to make some assumptions about the time needed
to stash carry-on baggage and take a seat, which in the real world would
include a normal or lognormal distribution having a specified mean and
standard deviation. However, for this project, you would be permitted to use
fixed constant values for the “stash and sit” time. Remember that people in
the aisle seat take the least time, and people in the window seat take the
most time, especially if other people have to stand up and move to the aisle
to make room for them.
4. There is a widespread belief in basketball that shooters may be “cold”
(i.e., on a missing streak) or may “have the hot hand” (i.e., be on a
successful streak). Neglect the effect of 3-pointers and free throws, and
focus only on 2-point field goals. If the cold/hot theory is true, how
different would a random stream of successes and failures look as compared to
a completely independent stream of successes and failures? Assume that a
player has an overall success rate from the field of 50% either way, but that
if the cold/hot theory is true, her success percentage temporarily increases
to 60% until the next failure, whereupon her failure percentage temporarily
increases to 60% until the next success. Compare the mean run length under
(1) the cold/hot theory and (2) completely independent trials. (For example,
FFFSSFSFFFSSSFFSSS has runs of 3, 2, 1, 1, 3, 3, 2, 3, for a mean of 2.25.)
5. The word “GOD” can be spelled out in the ASCII decimal character code as
717968. How often does GOD appear, on average, in a random stream of digits?
6. A game involving rolling a single fair die is structured as follows. You
will roll the die repeatedly, as many times as you wish, except that you must
stop if a “1” appears, in which case you are paid $1 as your prize.
Otherwise, your payoff is the number of dollars indicated by the die roll at
the point where you decide to stop. Compute the expected value of the game if
you decide to stop at the first occurrence of (a) 2 or greater, (b) 3 or
greater, (c) 4 or greater, (d) 5 or greater, (e) 6 only. It is not
interesting to compute the expected value of the game for people who decide
to stop at the first roll of 1 or greater, since that value is clearly the
value of a single roll, which is easily shown to be $3.50.
7. Here are 56 possible student codenames: Alpha, Bingo, Brain, Bravo,
Cackle, Clang, Crumb, Delta, Donkey, Drain, Drum, Echo, Feel, Fox, Gang,
Glee, Glue, Glyph, Golf, Hotel, India, Jazz, Jumble, Key, Kilowatt, Kite,
Log, Mango, Mumble, Nose, Platypus, Ramble, Ratchet, Right, Rotten, Seem,
Sierra, Stubble, Stumble, Sugar, Sweat, Swill, Tango, Think, Tickle, Topaz,
Trash, Trim, Tumble, Uncle, Uniform, Warthog, Whistle, Yankee, Zing, Zulu. If
35 students randomly choose codenames from this list, what is the probability
that everyone ends up with a unique codename (i.e., with no duplications)?
8. There are 25 randomly chosen strangers in a room. To simplify things,
assume that all birthdays are equally likely, except for Feb. 29, which is
only 1/4 as likely as each of the other days of the year. What is the
probability that at least 2 of the people in the room share a birthday (i.e.,
same day of the year, not necessarily the same day and year)?
9. A chest of 3 drawers is randomly arranged so that each drawer has exactly
2 coins in it. One drawer has 2 gold coins, one drawer has 2 silver coins,
and one drawer has both a gold coin and a silver coin. A drawer is selected
at random, and a coin is selected at random from that drawer. Given that the
coin is gold, what is the probability that the other coin in the same drawer
is gold?
10. In the camp 1960s and 1970s game show Let’s
Make a Deal, the host, Monty Hall, would frequently offer a contestant a
choice of Door #1, Door #2, or Door #3. Let us assume that the rules are as
follows. (They were not always this way, but let us set the rules precisely
so that it is clear what we are dealing with.) Two of the doors conceal junk
prizes, such as a goat chewing on a bale of hay. One door conceals a shiny
new car valued at $45,000. After choosing a door, Monty Hall will show you a
junk prize from one of the other doors. Note that he can always do this, and
in our version of the game, he must
show you a junk prize. Thus there is no “mind game” going on here. Now the
question: If you are given the option of STICKING with your original choice,
or SWITCHING to the other remaining door, which strategy gives you a better
probability of ending up with the car?
|
|
|
W 11/30/011
|
HW due:
1. Prepare for a quiz on this
week’s Quick Study article. Handwritten notes are permitted.
2. Re-think yesterday’s submission. All groups will probably be happier with
a refined or altered topic. Mr. Hansen is available for consultation by phone
or e-mail until 10:30 p.m. Tuesday.
3. Write a paragraph summarizing your project methodology. Some details may
be omitted for the moment, but you need to explain (a) how you will assign
digits to simulated events, (b) what constitutes success, at least in general
terms, and (c) how you will estimate the expected value or probability of interest.
If the group leader is absent, a deputy must deliver the paper.
4. If you wish to get started on your project, click here to download the
table of 1 million random digits.
|
|